
5 Tips To Get The Most Out Of The Reporting Feature
Have you ever wanted to know more about the reports feature but haven’t had a chance to explore its capabilities?
We’ve put together 5 handy tips for getting the most out of Storypark’s reports feature.
Monitor learning trends and activity at your learning service
If you want to better understand the learning trends and activity at your service, activity reports offer you several valuable insights such as:
- Whether parent engagement has increased or decreased
- Which children are getting the most stories, and which children are in need of stories
- Which families are engaging most with their child’s learning
- And so much more!
To access your centre’s reports, simply click on your early learning service’s ‘Reports’ tab.
Read more about how to do this here.

Save reports and add to plans as a way to further assess learning
Having the ability to save all trend and activity reports as PDF documents, means that you can easily attach them to your plans, which in turn helps you to develop a deeper understanding of children’s learning.
By clicking the ‘Export to PDF’ button on any of the four reporting sections, you can then save the report on your computer, or you can easily add it to a plan on Storypark.
Find out how to do this here.
Generate a report for individual children to show their progression of learning
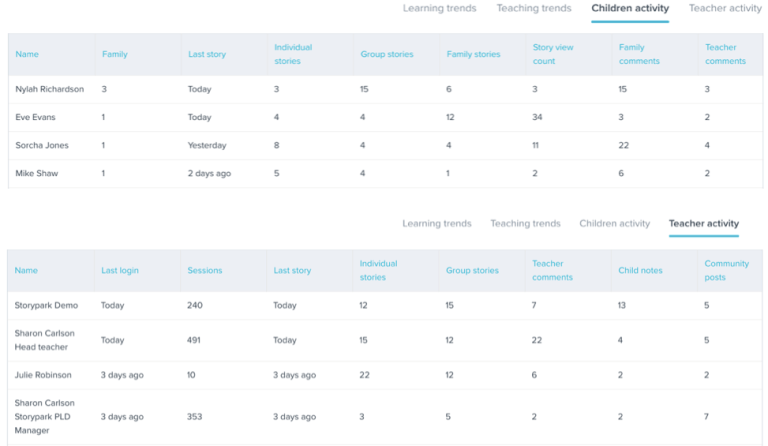
Ensure documentation of learning is happening for all children by generating ‘Child Activity Reports’. This type of report allows you to bring up activity on individual children’s profiles over a selected date range.
You are able to compare different sets of data such as the number of individual and group stories, teacher comments and child notes. You can also check family engagement stats for each child, showing you the number of comments and family stories added to each child’s profile.
Reports help you answer questions such as “What is the level of engagement from families? Are they commenting on learning stories? Are educators responding to these comments?”
Reports are displayed in an easy to read line graph. Beneath the graph is a table with the selected data sets for all children. Having the data displayed in both ways means you quickly and easily notice trends occurring for individual or groups of children.
Find out how to generate reports here.
Ensure learning tags are being used, and check that they reflect the teaching and learning that has taken place
Tracking which learning tags and sets are being used the most means you are able to gain valuable insight into what learning is taking place for the children in your learning service. You are able to do this for both individual children and groups of children.
With just a few clicks of your mouse, the data is generated in an easy to understand pie graph, bar graph or word cloud. By clicking on any segment of the graphs, an explanation of the tag, date and title of the last story it was used in will be displayed.
You can dig even deeper by clicking the split view button, generating two reports so that you can easily determine and compare data. Find out if there are individual or groups of children whose learning is being documented more. Are your teaching team documenting one type of learning more than another? Is the learning that happened six months ago, still a strong and recurring interest? It’s like research at the click of a button, and the insights you gain from the reports can better inform your planning and reflections.

Be informed about family engagement
Reporting also makes tracking family engagement easy. It is simple to find out how many family members are invited to individual children’s profiles, under ‘Child activity.’
The family column in this report shows the number of family members connected to each child’s profile. If the counter shows there are no family members connected to a child’s profile, you can then check the status of invitations you have sent to new parents.
If you are focusing on increasing family engagement via documentation of children’s learning, the activity reports can be easily generated. It is then easy to assess the number of family comments on your stories, and also the number of stories created by family members. You can then begin to gain a bigger picture, noticing trends such as whether using images or videos gain more engagement from families. Whether parents respond more to in-depth learning stories or shorter “learning snapshots”. Reports are available at both centre and room level, so are useful for both directors/managers and room leaders.
To further explore the reporting feature on Storypark, register for one of our upcoming online workshops. With a range of topics on offer, and with times to suit educators in most timezones, our PLD team will walk you through our features and are able to answer any specific questions you may have.
Share this: